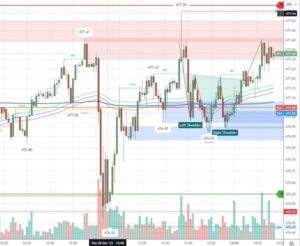
Unleash your inner financial detective with this interactive exploration of the SPY 1-minute chart! Our free courses can educate you to see the chart differently.
This isn’t your average data dump. We’ve gamified the experience with a variety of engaging activities to help you:
- Immerse yourself: Dive into the intricate details of the chart with zooming, panning, and highlighting tools.
- Identify patterns: Spot trends, reversals, and support/resistance levels with ease.
- Compare timeframes: Quickly switch between different time intervals to gain broader context.
- Test your knowledge: Answer insightful questions about the chart’s movements and key events.
- Sharpen your analysis: Reinforce your understanding of market dynamics.
- Learn by doing: Engage in active learning that sticks.
- Put your memory to the test: Recall specific price points and chart patterns.
- Boost your focus: Improve your ability to retain key information.
- Have fun!: Make learning enjoyable and interactive.
- Match wits with the chart: Connect relevant news headlines and events to specific chart movements.
- Develop critical thinking: Analyze the relationship between market news and price action.
- Expand your perspective: Gain a holistic understanding of market influences.
- Piece together the story: Order a series of screenshots to understand the chart’s progression.
- Challenge your perception: Decipher cause-and-effect relationships within the market.
- Think outside the box: Approach the chart from a unique angle.
This is more than just a chart; it’s an immersive learning experience! Whether you’re a seasoned trader or just starting out, this interactive exploration will help you:
-
- Deepen your understanding of market movements.
- Develop essential analytical skills.
- Have fun while learning!


