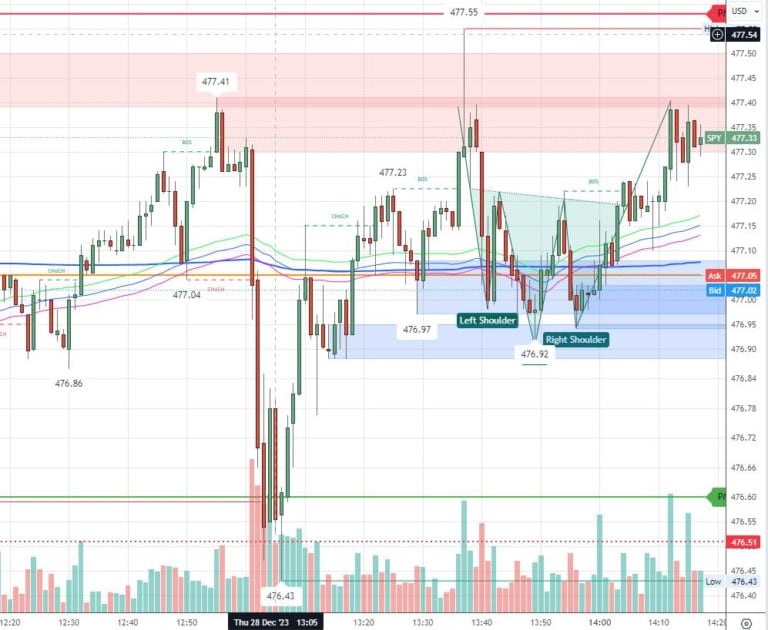
The Head and Shoulders chart pattern is a popular technical analysis chart pattern that traders widely use to identify the potential reversal of an uptrend. The head and Shoulders pattern is formed by three sequential peaks, with the middle peak being the highest and the other two forming lower peaks on either side, creating a shape resembling a human head and shoulders.
The pattern is considered complete when the price action breaks below the neckline, which is a support level that connects the low points of the two shoulders. This is usually when traders enter a short position, indicating a high probability of a bearish trend reversal. However, it is important to note that this pattern is unreliable and should be used with other technical analysis tools and indicators to make informed trading decisions.
Have you tried our different Free Courses/quizzes on Stock Patterns?
Traders often use the Head and Shoulders pattern to identify potential profit opportunities in the stock market. Still, it’s essential to consider other factors, such as price action, other technical tools, market sentiment, volume, and fundamental analysis, before making any trading buy and sell decisions. The head and shoulders pattern is just one of the many tools traders use to identify potential opportunities in the market, and it should be used in conjunction with other tools and strategies to make informed trading decisions.
To master the different types of SPY Head and Shoulders 1 Min Chart Pattern, you can try the quiz, memory game, image pairing, image sequencing, and visualizing in the course or blog.


